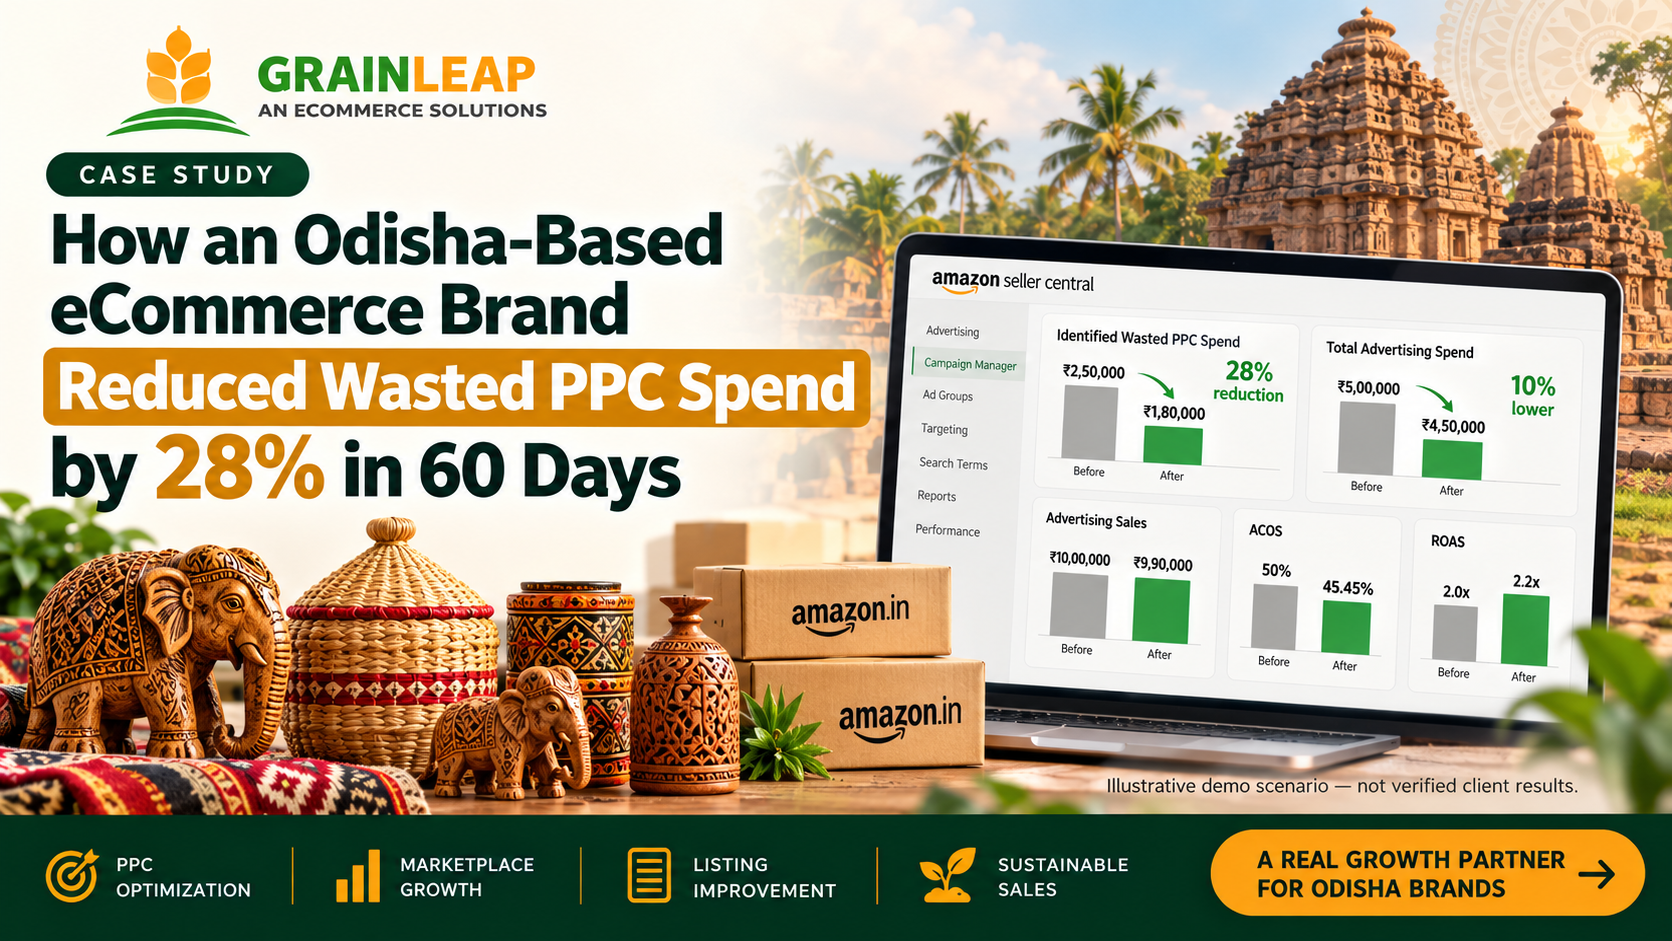



A 90-day programme of listing optimization, PPC restructuring, SEO and conversion work for an ecommerce brand selling on Amazon and similar marketplaces.
Illustrative sample figures. Replace every value marked with verified client data (exported from Seller Central, ad console and analytics) before publishing.
Summary: Weak listings and unstructured ad campaigns were limiting growth. By fixing content, restructuring PPC and tracking results weekly, the brand raised revenue and orders while spending a smaller share of revenue on advertising.
Performance analysis
Baseline is the monthly average of the 90 days before the engagement. Result is month 3 of the programme.
| Metric | Before | After | Change |
|---|---|---|---|
| Monthly revenue | $42,000 | $68,500 | +63% |
| Monthly orders | 1,150 | 1,720 | +50% |
| Sessions | 14,000 | 15,100 | +8% |
| Conversion rate | 8.2% | 11.4% | +3.2 pts |
| ACoS | 38% | 24% | -14 pts |
| TACoS (ad spend / total revenue) | 15.8% | 11.2% | -4.6 pts |
| Organic share of sessions | 31% | 44% | +13 pts |
Monthly revenue, baseline vs programme months
Audit findings
The audit covered listings, advertising, search visibility, conversion and tracking.
| Problem found | Priority | Business impact |
|---|---|---|
| Titles and bullets missed high-intent search terms | High | Low organic ranking and fewer free visits |
| Weak main images and no A+ content | High | Shoppers viewed the page but did not buy |
| Ad campaigns mixed broad, exact and branded terms | High | Wasted spend and unclear results |
| No negative keyword management | Medium | Budget lost on irrelevant clicks |
| Frequent stock-outs on top sellers | Medium | Lost sales and ranking drops |
| No regular reporting on margin or TACoS | Medium | Decisions made without profit data |
Service strategy
Marketplace management
- Account health and policy checks
- Inventory and pricing rules
- Catalogue and variation clean-up
Listing optimization
- Keyword-led titles, bullets and descriptions
- New image sets and A+ content
- Backend search terms
PPC
- Campaigns split by match type and goal
- Negative keyword lists
- Bid rules tied to target ACoS
SEO
- Keyword research by buyer intent
- Brand store and landing page optimization
- Content that supports off-marketplace search
CRO
- Split tests on images and titles
- Review and rating improvement
- Price and offer testing
Analytics
- Weekly dashboard for revenue, TACoS and conversion
- Margin tracking per product
- Monthly review with the client
90-day roadmap
Days 1-15: Audit
Review account, listings, ads and data. Set baselines and agree targets.
Days 16-45: Implementation
Publish new listings and images, rebuild campaign structure, fix inventory alerts and set up reporting.
Days 46-75: Testing
Run split tests on images, titles and offers. Compare results against baseline weekly.
Days 76-90: Optimization
Scale winning tests, cut weak campaigns and plan the next quarter.
ROI analysis
| Item | Amount |
|---|---|
| Incremental revenue vs baseline (month 1 + 2 + 3: $4,000 + $17,000 + $26,500) | $47,500 |
| Contribution margin after ad spend and marketplace fees (35%) | $16,625 |
| Service cost (3 months at $4,500) | $13,500 |
| Net gain | $3,125 |
| 90-day ROI (net gain / service cost) | 23% |
| Month-3 run-rate ROI ($9,275 contribution vs $4,500 cost) | 106% |
Safeguards: incremental revenue is measured against the pre-engagement baseline, not against a target. Seasonality, price changes, promotions and new product launches must be reviewed before attributing the gain to the service. Margin is the client's own figure. Results vary by category, competition and budget, and past results do not guarantee future performance.
Key learnings
- Fixing listing content first made every ad dollar work harder.
- Structured campaigns lowered ACoS and made results easier to read.
- Tracking TACoS and margin, not just ad sales, kept growth profitable.
- Weekly testing turned small conversion gains into steady revenue.
"Before this programme we were spending on ads without knowing what worked. Within three months our listings converted better, our ad costs dropped and we finally had a weekly report we could trust. The team explained every change and the numbers backed it up."Priya Sharma, Founder, Brightnest Home Co. (illustrative testimonial with a fictional name. Replace with an approved client quote and written permission before publishing.)
Want a similar audit for your store?
Share your marketplace storefront and we will send a free audit with the top fixes for listings, ads and conversion.
Request a free audit